Algorithms Overview
RNA library analysis
estep1: barcode/UMI extraction
RNA library structure: 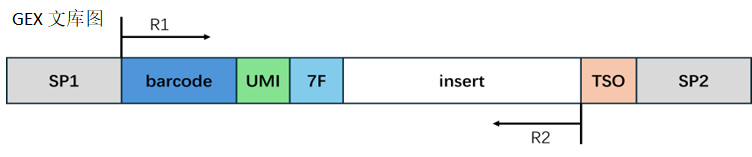
Barcode processing:
The corresponding sequence is extracted based on the structural design. When the extracted barcode sequence is found in the whitelist, it is considered a valid barcode and the read count with valid barcodes is recorded. When the barcode is not found in the whitelist, it is considered an invalid barcode.
During sequencing process, there is a certain probability that sequencing error occurs. With the presense of a whitelist, SeekArcTools are able to do barcode correction. When correction is enabled, if sequences that are one base differ (one humming distance apart) from the invalid barcode appear in the whitelist, we will consider the following circumstances:
If there is one and only sequence exists in the whitelist, we will correct the invalid barcode to the barcode in the whitelist.
If multiple sequences exist in the whitelist, we will correct the invalid barcode to the sequence with the highest read support.
Adapter processing:
In the RNA library, the end of Read2 may contain the reverse complement sequence of 7F, which could be an adapter sequence introduced during library preparation. We remove these contaminating sequences, and the length of the trimmed Read2 needs to be longer than the set minimum length to ensure sufficient information for accurate alignment to the genome. If the length of Read2 after trimming is shorter than the minimum length, we consider this read as an invalid read.
estep2: Alignment
Sequence Alignment
SeekArcTools uses an aligner software called STAR to perform splicing-aware alignment of reads to the genome.
After the alignment procedure has mapped the reads to the genome, SeekSoulTools uses another software called QualiMap along with a gene annotation transcript file GTF to bucket the reads into exonic, intronic, and intergenic regions.
Using featureCounts, the reads aligned to the genome were annotated to genes, with different rules such as strand specificity and features used for annotation. When using exon for annotation, a read is annotated to the corresponding gene if over 50% of its bases are aligned to the exon. When using transcripts for annotation, a read is annotated to the corresponding gene if over 50% of its bases are aligned to the transcript.
After the processing procedure described above, the metrics is shown below:
Reads Mapped to Genome: Fraction of reads that aligned to the genome (including both uniquely mapped reads and multi-mapped reads)
Reads Mapped Confidently to Genome: Fraction of reads that uniquely mapped to the genome
Reads Mapped to Intergenic Regions: Fraction of reads that mapped to intergenic regions
Reads Mapped to Intronic Regions: Fraction of reads that mapped to intronic regions
Reads Mapped to Exonic Regions: Fraction of reads that mapped to exonic regions
estep3: Counting
UMI counting
SeekSoulTools extracts group of reads that shared the same barcode from output BAM file and counts the number of UMIs annotated to genes and the number of reads corresponding to each UMI.
Filter out reads whose UMIs consist of repetitive bases. For example, TTTTTTTT.
If a read has multiple annotations and only one gene annotation is from exon, it is considered a valid read, and all others are filtered.
UMI correction
UMIs may also have sequencing errors during sequencing process. By default, SeekArcTools uses the adjacency from UMI-tools to correct UMIs.
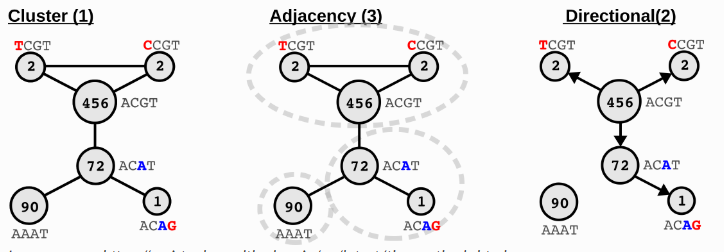
Image source: https://umi-tools.readthedocs.io/en/latest/the_methods.html
ATAC library analysis
astep1: Barcode extraction
Atac library structure: 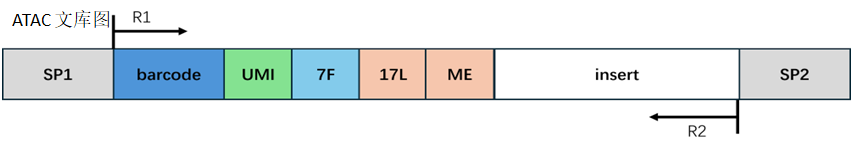
Barcode processing:
Same processing method as estep1.
Adapter and reads processing:
In the Atac library, Read1 may contain a fixed sequence at the end, which could include adapter sequences; the end of Read2 may contain the reverse complement of the fixed sequence and adapter sequences. We remove these contaminating sequences, and the length of the trimmed Read1 or Read2 needs to be longer than the set minimum length to ensure sufficient information for accurate alignment to the genome. If the length of Read1 or Read2 after trimming is shorter than the minimum length, we consider this read as an invalid read; if the length of Read1 or Read2 after trimming is greater than 50, we truncate the first 50bp of the Read1 or Read2 sequence; if the length of Read1 or Read2 after trimming is less than 50 but greater than the minimum length, we retain the entire sequence of Read1 or Read2.
estep2: Alignment
Sequence Alignment
Use bwa mem to align the processed Read1 and Read2 to the reference genome.
astep3: Counting
Use SnapATAC2 v2.8.0 to process the BAM file output from astep2.
Read the BAM file to obtain ATAC sequencing and mapping metrics.
Generate the raw fragments file from the BAM file. Filter out mitochondria fragments to obtain the filtered fragments file.
Generate an Anndata object from the filtered fragments file.
Plot the distribution of TSS score.
Use MACS3 to call peaks, filter duplicate peaks, and output to peaks.bed.
Generate raw_peaks_bc_matrix dir based on peaks.
Calculate metrics for each barcode and output to per_barcode_metrics.csv.
Plot the distribution of insert sizes.
Cell calling
Generate filtered_feature_bc_matrix and filtered_peaks_bc_matrix.
Calculate ATAC library metrics for cells and targeting.
Cell calling
If --min_atac_count and --min_gex_count are specified:
Then determine the barcode as a cell if the UMI count is greater than the min_gex_count value and the events count is greater than the min_atac_count value.
If not specified:
First, retain barcodes where the UMI count is greater than 1 or the events in peaks count is greater than 1.
Then, filter barcodes where “the fraction of fragments overlapping called peaks” is less than “the fraction of genome in peaks”.
Deduplicates. Filter barcodes with identical UMI values and events in peaks values.
Perform log10 transformation on the UMI values and events in peaks values of the filtered barcodes.
Based on the transformed UMI values and events in peaks values, use the KMeans algorithm to divide the barcodes into two clusters. The cluster with the higher mean is identified as cells, while the other is not.
Map the barcodes filtered out during deduplication to cells or non-cells based on the determination of the remaining barcodes.
astep4: Subsequent analysis
After the above steps, with the obtained cell expression matrix and ATAC matrix, we can proceed to the next stage of analysis.
Use Signac v1.14.0 to merge the cell expression matrix and ATAC matrix into a single Seurat object, Filter out features not in the database, then normalize the expression matrix and ATAC matrix separately, identify highly variable genes, perform dimensionality reduction and clustering, find differential genes, conduct WNN clustering, and finally calculate feature links.